![]()
Missing Data Visualization
Intercurrent events and MI
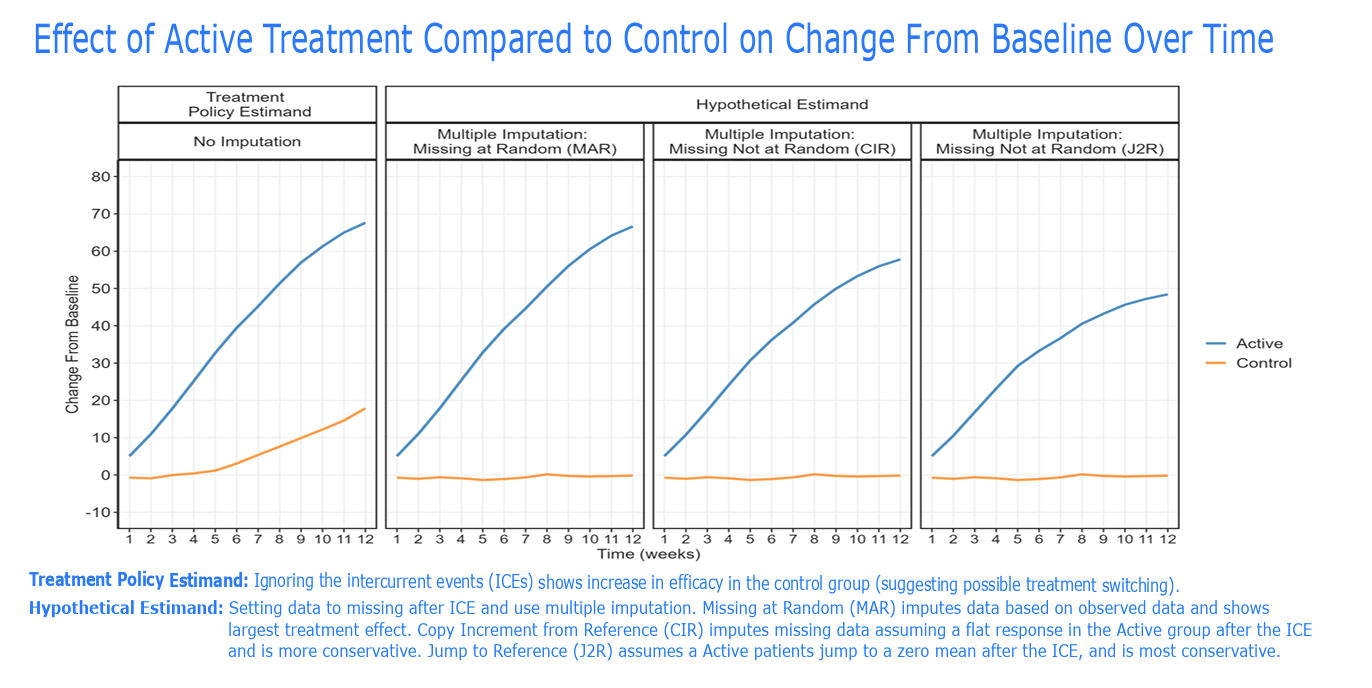
In clinical trials, intercurrent events are post-baseline occurrences that affect the interpretation or existence of outcome data. Visualisations help understand the possible impact of these events on the interpretation of the study results.
SIG (2025, Aug. 13). VIS-SIG Blog: Wonderful Wednesday August 2025 (65). Retrieved from https://graphicsprinciples.github.io/posts/2025-08-13-wonderful-wednesday-august-2025/
Faceted line plot
Visualization side by side
df <- read_excel("./01_Datasets/WWW_AUG2025.xlsx") %>%
  mutate(AVISITN = case_when(AVISIT=="BASE" ~ 0,
                             AVISIT!="BASE" ~
                               as.numeric(substring(AVISIT, nchar(AVISIT)-1))))

# Variable for Sample Size of Each Arm
N_A <- as.numeric(length(unique(df[df$TRT=="Treatment A",]$USUBJID)))
N_B <- as.numeric(length(unique(df[df$TRT=="Treatment B",]$USUBJID)))

# Mean Scores Over Time Ignoring ICEs
df_mean <- aggregate(as.numeric(df$AVAL),
                     by=list(df$TRT, df$AVISITN),
                     FUN=mean) %>%
  rename(Treatment = Group.1,
         Month = Group.2,
         Mean = x)

p1 <-
  ggplot(df_mean, aes(x=Month, y=Mean, colour=Treatment)) +
  geom_line() +
  geom_point() +
  scale_y_continuous(limits = c(0, 100),
                     expand = c(0, 0),
                     breaks = seq(0, 100, by = 10)) +
  scale_x_continuous(limits = c(0, 12.1),
                     expand = c(0, 0),
                     breaks = seq(0, 12, by = 1)) +
  labs(title = "Ignoring Intercurrent Events",
       subtitle = "Mean Scores Increase With Both Arms but are Higher for
       <span style = 'color: #F8766D;'>Treatment A</span>
       vs
       <span style = 'color: #619CFF;'>Treatment B</span>",
       caption = paste("Data analysed as observed \n (i.e.,",
       "data preceded by intercurrent events included as recorded). \n",
       "Treatment A: N =", N_A, "Treatment B: N =", N_B)) +
  theme_bw() +
  theme(panel.border = element_blank(),
        axis.line = element_line(color = "black"),
        panel.grid.minor = element_blank(),
        panel.grid.major.x = element_blank(),
        panel.grid.major.y = element_line(linewidth = 0.5),
        axis.title.y = element_blank(),
        plot.title = element_markdown(size = 15, hjust = 0.5),
        plot.subtitle = element_markdown(size = 11,
                                         margin = margin(0, 0, 15, 0),
                                         hjust = 0.5),
        plot.caption = element_text(hjust = 0,
                                    margin = margin(15, 0, 0, 0)),
        legend.position = "none",
        plot.margin = margin(15, 5, 0, 0))

# Repeating with scores set to missing and imputed with LOCF following ICEs
df_locf <- df %>%
  group_by(USUBJID) %>%
  mutate(AVALlocf = case_when(ICE == "N" ~ as.numeric(AVAL))) %>%
  fill(AVALlocf, .direction = "down") %>%
  ungroup()

df_locf_mean <- aggregate(as.numeric(df_locf$AVALlocf),
                     by=list(df_locf$TRT, df_locf$AVISITN),
                     FUN=mean) %>%
                rename(Treatment = Group.1,
                       Month = Group.2,
                       Mean = x)

p2 <-
  ggplot(df_locf_mean, aes(x=Month, y=Mean, colour=Treatment)) +
  geom_line() +
  geom_point() +
  scale_y_continuous(limits = c(0, 100),
                     expand = c(0, 0),
                     breaks = seq(0, 100, by = 10)) +
  scale_x_continuous(limits = c(0, 12.1),
                     expand = c(0, 0),
                     breaks = seq(0, 12, by = 1)) +
  labs(title = paste("Imputing Post-Intercurrent Event Visits With LOCF"),
       subtitle = "Mean Scores Increase With
       <span style = 'color: #F8766D;'>Treatment A</span>
       But Not With
       <span style = 'color: #619CFF;'>Treatment B</span>",
       caption = paste("Data preceded by an intercurrent event set to missing",
                       "and imputed using \n last observation carried forward",
                       "(LOCF). \n",
                       "Treatment A: N =", N_A, "Treatment B: N =", N_B)) +
  theme_bw() +
  theme(panel.border = element_blank(),
        axis.line = element_line(color = "black"),
        panel.grid.minor = element_blank(),
        panel.grid.major.x = element_blank(),
        panel.grid.major.y = element_line(linewidth = 0.5),
        axis.title.y = element_blank(),
        plot.title = element_markdown(size = 15, hjust = 0.5),
        plot.subtitle = element_markdown(size = 11,
                                         margin = margin(0, 0, 15, 0),
                                         hjust = 0.5),
        plot.caption = element_text(hjust = 0,
                                    margin = margin(15, 0, 0, 0)),
        legend.position = "none",
        plot.margin = margin(15, 0, 0, 5))


# Adding to plots to single plot with common title
meanplot <- grid.arrange(p1, p2, ncol=2,
                         top = textGrob("Mean VAS Scores by Visit",
                                        gp=gpar(fontsize=20)))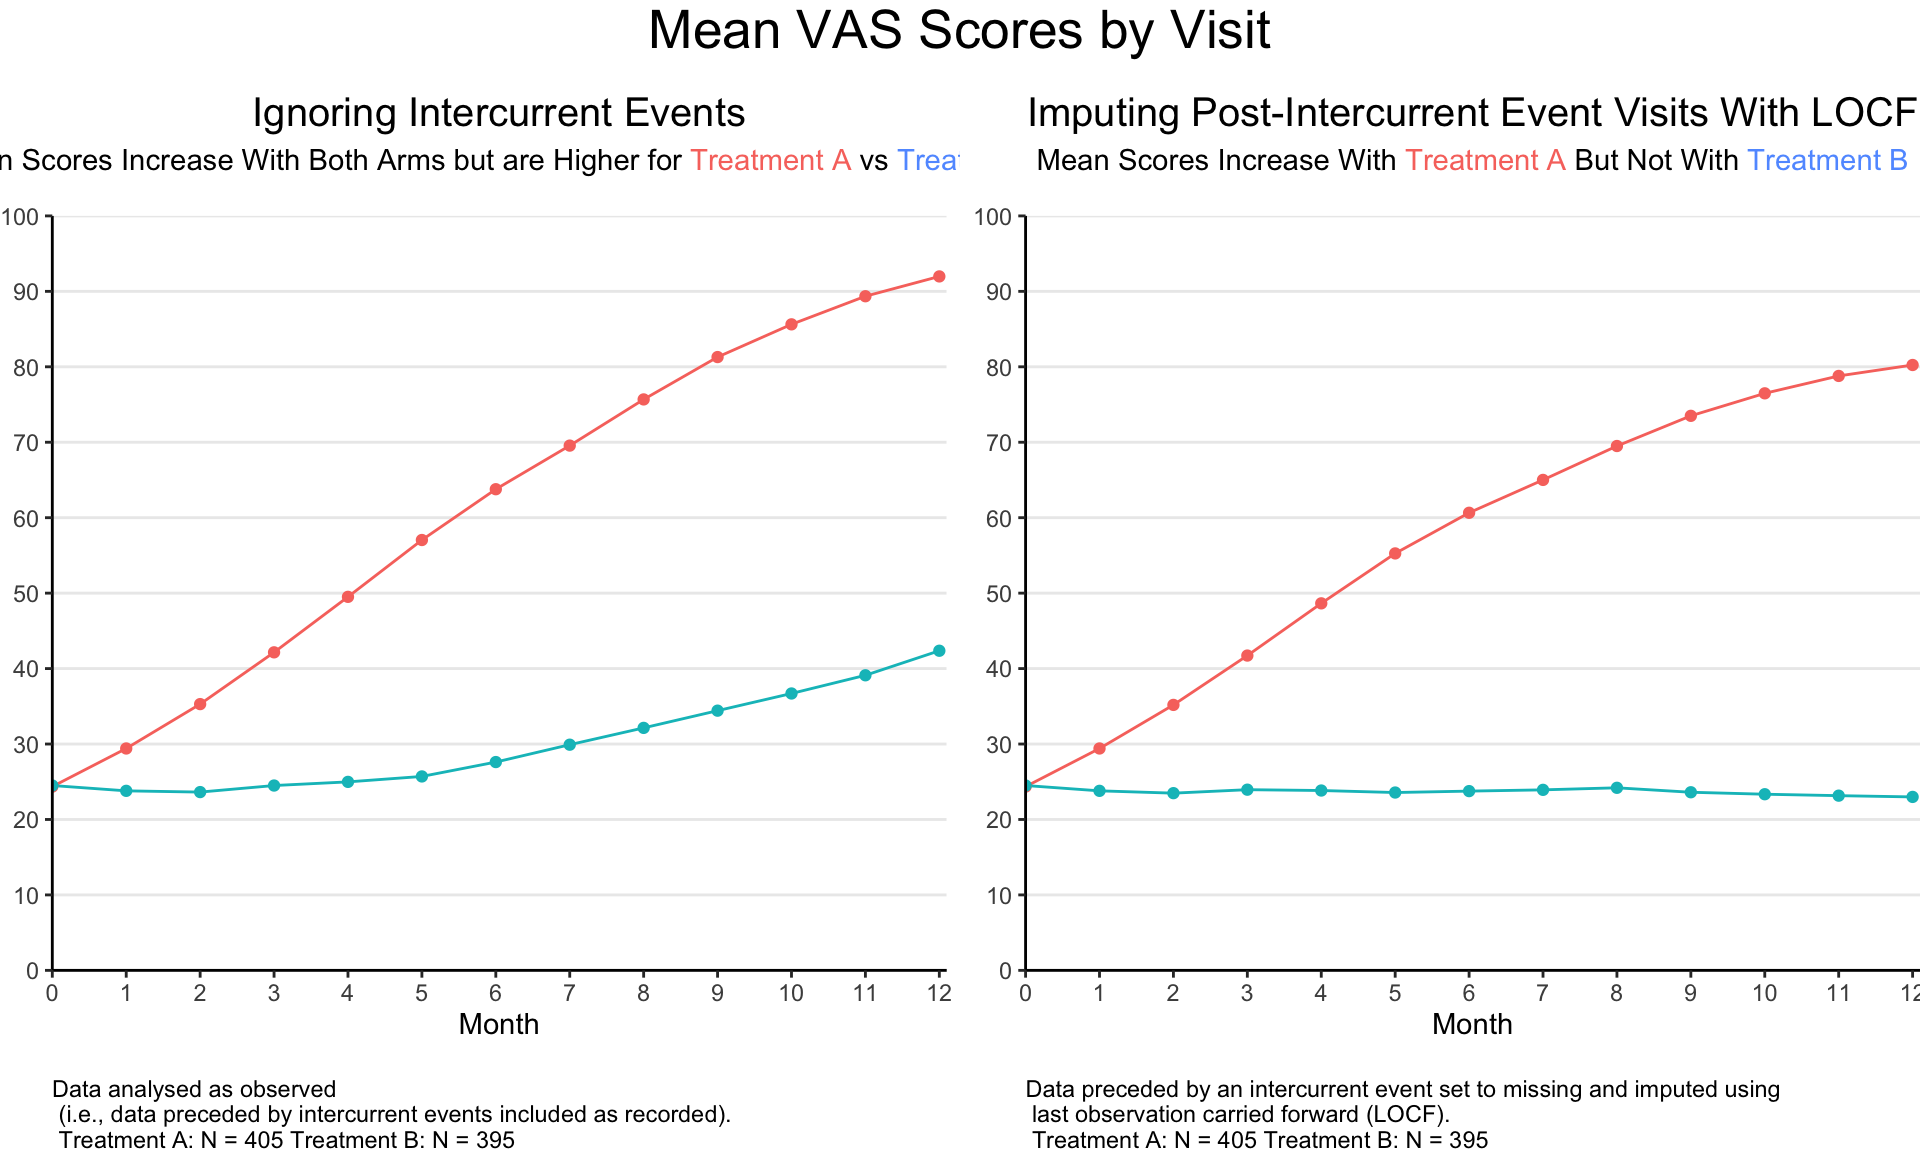
meanplot## TableGrob (2 x 2) "arrange": 3 grobs
## z cells name grob
## 1 1 (2-2,1-1) arrange gtable[layout]
## 2 2 (2-2,2-2) arrange gtable[layout]
## 3 3 (1-1,1-2) arrange text[GRID.text.145]Individual Anker Point
Reference
SIG (2025, Aug. 13). VIS-SIG Blog: Wonderful Wednesday August 2025 (65). Retrieved from https://graphicsprinciples.github.io/posts/2025-08-13-wonderful-wednesday-august-2025/